General News » News
Want to see where to locate a new Tim Hortons? Students learn there’s an app for that!
December 21, 2016 · 0 Comments

By Brock Weir
Do you have a spare million or two kicking around and you’re wondering what to do with it?
You might want to take a tip out of the playbook of Pickering College students who have been tinkering with an app to figure out the best and most logical place to locate a new Tim Hortons franchise in a community where it seems like there’s just about one on every corner.
Of course, this is just one of the practical ways students are learning how to deploy the ArcGIS Collector App from ESRI. Over the last few months, teens in Pickering College’s Senior School have been using the app to collect data, pinpoint the data using GPS coordinates, and collect the information to find practical solutions to almost an unlimited number of problems.
Take trash, for instance.
Over the course of the fall, groups of students fanned out across the Pickering College campus logging each piece of garbage they found by type and location. Collecting the data onto a virtual map, they used their findings to determine trends in on-campus garbage and best ways to tackle the issue, including ideal locations for new bins.
“The students are discovering GIS technology and they are trying to find correlations between different layers,” says teacher Steve Cope. “The obvious one is the Tim Hortons example and population density. If you have got the money to open a Tim Hortons franchise, where would you open it? You need lots of people, so you need the density, but you don’t want to be close to another Tim Hortons location or Starbucks. That is a problem somebody came up with in our class, and you can find input data on wealth, spending, and all sorts of things.”
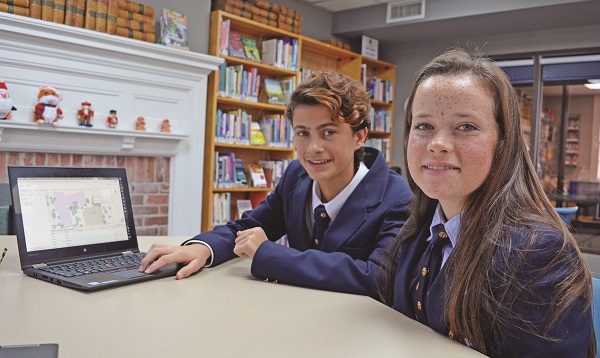
During a recent visit to Pickering College, an assortment of different applications for the technology were excitedly demonstrated by student Damian Larice and explained by fellow student Katherine Starr.
“We had to find two layers of whatever we wanted to talk about,” says Katherine. “There are just so many different options you could have to find out an answer. Some students talked about ocean currents and weather. Some did an obesity rate with McDonald’s. I think it is really informative to do things like this because you really get to see some of the issues that we have, or some of the things we can learn about in school. This is something I won’t be using just this year – I can definitely use this for the rest of my life, proving different things around the world, whether it is based on environment or based on our society.”
As Katherine explained, Damian demonstrated with quick fingers just how the information can be used to show wide-ranging issues, including compiling data on how global warming and climate change is viewed around the world and using data on population density, average wind speeds and topography, to determine the ideal location for a wind farm.
Citing recent political debates in Mississauga over the implementation of penalties and incentives on greenspace versus concrete, he quickly pulled up data compiled by students showing not only how Pickering College fared on the concrete to greenspace ratio, but also how the school fared on the ratio compared to the smallest country in the world, Vatican City.
“It is pretty fun and we really get into it,” says Damian.
Adds Mr. Cope: “It can be a pretty powerful tool if used properly!”


